 One of the most commonly used GCS is the WGS 1984 (World Geodetic System 1984). This system is commonly used for sharing global locations, particularly with a GPS.
After completing this lesson, you’ll be able to:
Thinking back to my classroom days, and spinning a globe to determine my future, I realize I could have played this same game with similar results with the flat hanging map on the chalkboard. Could my friends and I not have chosen to spin ourselves dizzy, then stumble-walked towards the map, and pointed out a location that way?
Yes, we could have, if our teacher hadn’t rolled his eyes and called us disruptive, threatening to take away recess.
We would have been able to do this because a projected coordinate system had been utilized to translate the 3D reality of our world (aka. A globe that uses a geographic coordinate system) to a flat 2D depiction. Handy for human interaction and classroom mischief (or learning).
Now that you know that a geographic coordinate system (GCS) is made up of a datum, angular units, and a prime meridian, let’s see how it actually works. It’s a lot easier to understand if you look at a picture.
One of the most commonly used GCS is the WGS 1984 (World Geodetic System 1984). This system is commonly used for sharing global locations, particularly with a GPS.
While the information gained from a GPS can be extremely useful, solely relying on a geographic coordinate system isn’t going to solve all your coordinate system problems.
We’ve all seen and managed that “Location” setting on our mobile devices, which enables your phone to measure GPS coordinates. That’s great and all, but imagine just being given a string of numbers from a GPS and nothing else. You’d know exactly where you were, but how in the heck would you ever make it to dinner in time in rush hour traffic without all of those super-secret side street route options being revealed? That’s why Google Maps and Apple Maps are pretty ubiquitous these days for navigating around.
Coordinate data becomes so much more accessible and meaningful to us when it’s moved from a GCS to a Projected Coordinate System (PCS), which takes the where identified in a GCS, tells us how to draw that information to a flat surface (like your phone screen) using a projection method. I know that I would quite literally be lost without projected coordinate systems in my life.
When it comes to a projected coordinate system (PCS), we first need to understand what a “projection” is.
Basically, there’s more than one way to peel an orange. You’ve got a nice, spherical orange, just asking to be eaten. You peel off the skin and pop a slice into your mouth. Yum. The orange peel, once wrapped around your orange, is now able to lie flat on the table because of the ways you ripped through the peel. That first orange was just so darn good, you gotta have another one. Another orange peel lies flat on the table, this one with a different pattern of tears. Projection is just that – the method by which we “peel” the Earth and lay it out flat.

A peeled orange. By Shunichi Kouroki, licensed CC-BY-2.0.
However, when it comes to maps, we aren’t just “peeling and laying the Earth flat”. We’re trying to represent something that’s spherical into 2D as a rectangle (or other shape), in a consistent way without tears to break up the image. There are a number of different projection methods used because moving from 3D space to 2D space will always result in distortion of some kind. Different projection algorithms are selected to preserve as many of the following qualities as possible to varying degrees, but note, all four can never be preserved in 2D:
As an example, check out how the Mercator projection works. To put everything on a flat, rectangular surface, countries closest to the poles see a distortion of the area where they end up being displayed larger than they are as they are stretched to fill the rectangle space.
Take Greenland vs. Brazil for an extreme example of the Mercator projection. While Greenland appears to be larger than Brazil in the Mercator projection, in reality, the area of Greenland is 2,166,086 km², and Brazil is 8,515,767 km².
The Mercator projection has chosen to prioritize direction and conformality over area (it was originally designed for marine navigation to help ships sail using compass directions). (Wikimedia, CC-BY-SA)
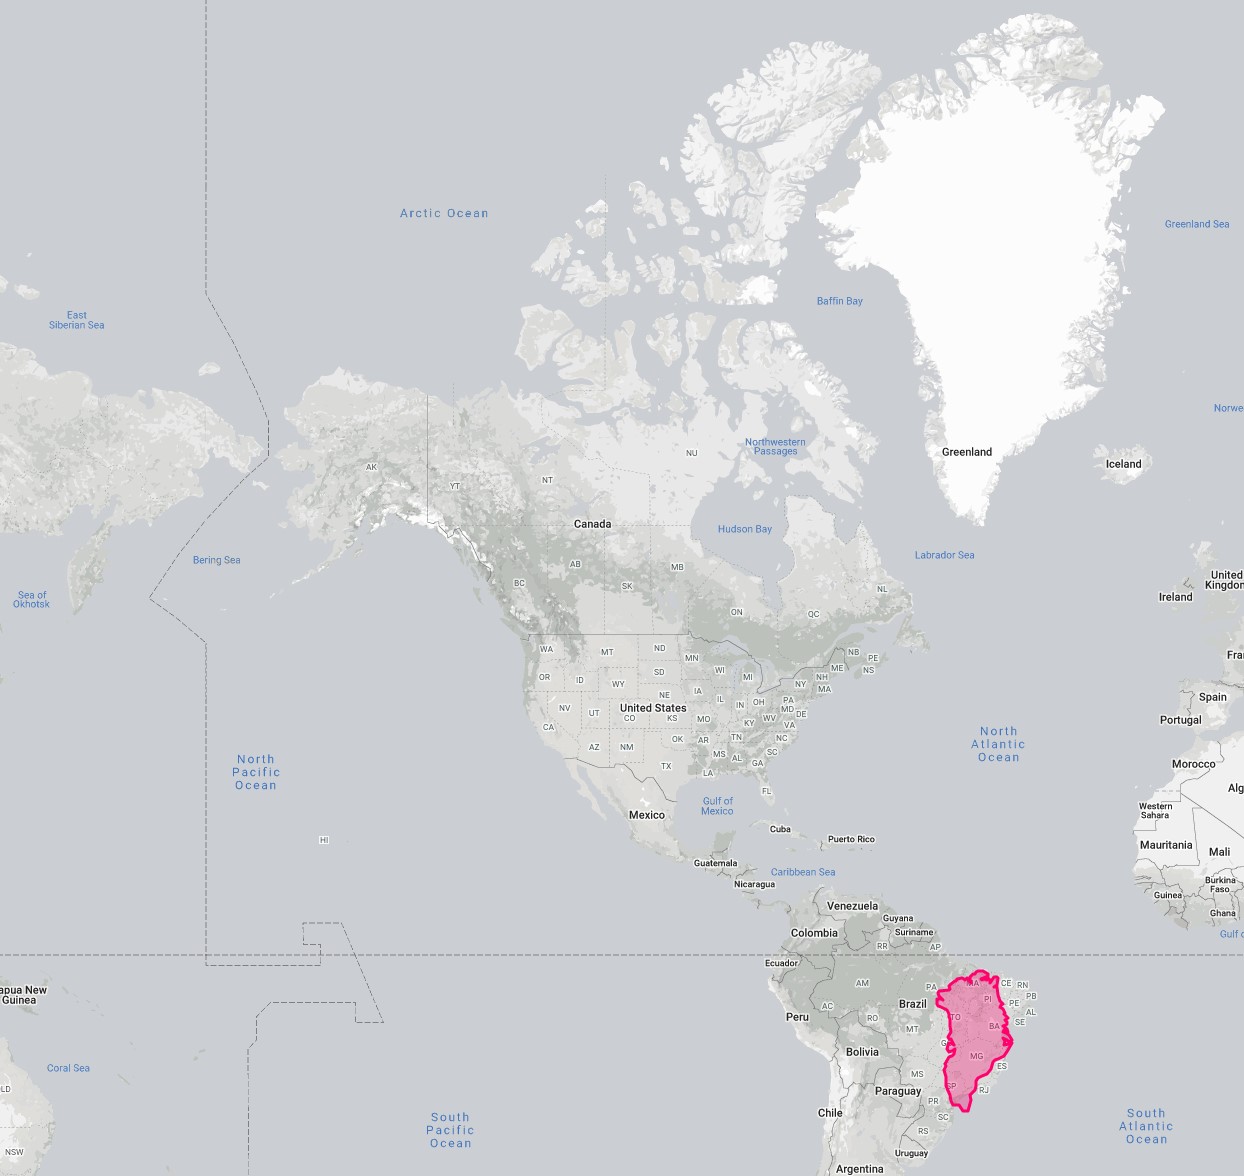
This screenshot was taken from The True Size – which allows you to experience how Mercator projection has chosen to prioritize direction and conformality over area (it was originally designed for marine navigation to help ships sail using compass directions).
One additional key difference between a GCS and PCS is that since a PCS is a flat, 2D representation of the Earth’s surface, a PCS will use linear units to measure distances instead of angular units. Units like feet, meters, links, or chains are all commonly used with projected coordinate systems. Therefore, spatial analysis, e.g. measuring area or distance, should only be conducted with data using a projected coordinate system.
A local coordinate system optimizes for accuracy for a specific location. These are most often used by local governments, construction teams, and surveyors because the narrower the area a coordinate system needs to cover, the less distortion you need to account for on a global scale when projecting.
This is why we have thousands of coordinate systems — because they have been created and optimized to reduce distortion of the area, distance, shape, direction or any combination of those within a certain location.
For example, the federal government of Canada is dependent on NAD83 (North American Datum 1983) while the province of British Columbia, Canada, uses NAD 1983 BC Albers, which defines a projection method specific to the provincial boundaries.
